Multiple Choice
Graph 13-5 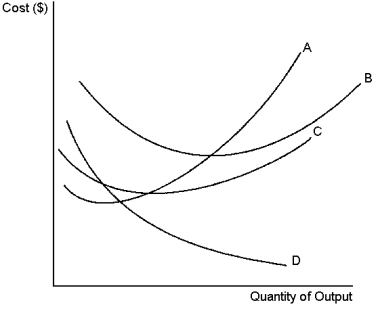 The set of curves above reflect information about the cost structure of a firm.Use this graph to answer the following question(s) .
-Refer to Graph 13-5.Which of the curves is most likely to represent average variable cost?
A) A
B) B
C) C
D) D
Correct Answer:

Verified
Correct Answer:
Verified
Q156: If the average total cost curve is
Q182: The adage 'Jack of all trades, master
Q183: Table 13-2<br>Adrienne's Premium Boxing Service subcontracts with
Q184: An economist measures profit as:<br>A)total revenue minus
Q185: An important implicit cost of almost every
Q187: Economies of scale occur when:<br>A)long-run average total
Q188: The law of supply states that:<br>A)the supply
Q189: According to the information provided, which of
Q190: Table 13-2<br>Adrienne's Premium Boxing Service subcontracts with
Q191: When a factory is operating in the