Multiple Choice
Graph 13-6
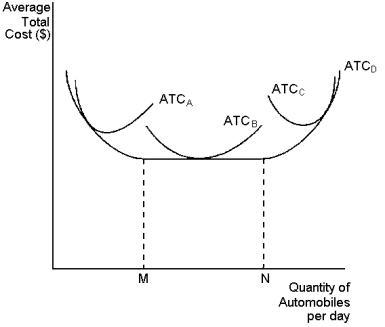 This graph depicts average total cost functions for a firm that produces automobiles. Use the graph to answer the following question(s) .
-Refer to Graph 13-6. If the firm is currently operating on ATCB, what options does it have if it wants to change its level of automobile production over the next couple of weeks?
A) the firm has no options. It cannot change output level in the short run
B) it can operate at any level of output between points M and N
C) it can operate at any level of output, as long as it stays on ATCD
D) it can operate at any level of output as long as it stays on ATCB
Correct Answer:

Verified
Correct Answer:
Verified
Q48: According to the information provided, what is
Q59: Graph 13-5 <img src="https://d2lvgg3v3hfg70.cloudfront.net/TB8859/.jpg" alt="Graph 13-5
Q60: The marginal cost curve crosses the average
Q68: The long-run average total cost curve is:<br>A)flatter
Q82: Economists class the short run as the
Q83: Identify the statement about the production function
Q90: Which of the following is an implicit
Q108: Marginal cost tells us the:<br>A)amount total cost
Q133: When average total cost rises if a
Q215: How would a production function that exhibits