Multiple Choice
Graph 13-6
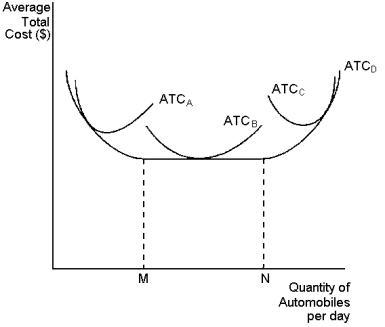 This graph depicts average total cost functions for a firm that produces automobiles. Use the graph to answer the following question(s) .
-Refer to Graph 13-6. At levels of output above point N, the firm experiences:
A) economies of scale
B) accounting profit
C) economic profit
D) diseconomies of scale
Correct Answer:

Verified
Correct Answer:
Verified
Q2: Graph 13-2 <img src="https://d2lvgg3v3hfg70.cloudfront.net/TB8859/.jpg" alt="Graph 13-2
Q40: Implicit costs that do not require a
Q43: Graph 13-5 <img src="https://d2lvgg3v3hfg70.cloudfront.net/TB8859/.jpg" alt="Graph 13-5
Q53: The use of specialisation to achieve economies
Q69: Table 13-1<br>Measures of Cost for Splashy Cardboard
Q73: Economic profit is equal to:<br>A)total revenue minus
Q74: If a firm increases its output by
Q77: In the long run there are no
Q81: Table 13-3<br>Consider the following firm which makes
Q186: Graph 13-5 <img src="https://d2lvgg3v3hfg70.cloudfront.net/TB8859/.jpg" alt="Graph 13-5