Multiple Choice
Three scatter diagrams are given below.How many of the diagrams present data that can be described by a linear relationship and,therefore,justifiably summarized by the correlation coefficient?
Plot A 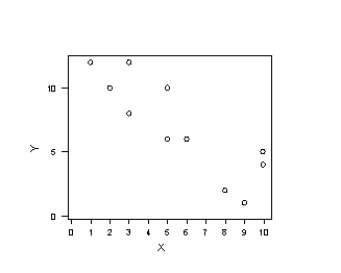
Plot B 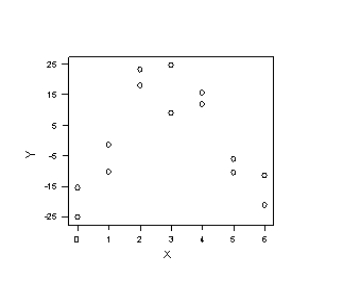
Plot C 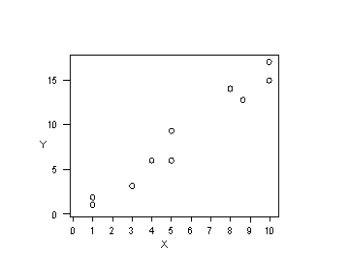
A) Plot A
B) Plot B
C) Plot A and Plot B
D) Plot A and Plot C
Correct Answer:

Verified
Correct Answer:
Verified
Q2: What is probability? What are its characteristics?
Q28: Two events are independent if they have
Q29: A frequency distribution is a table that
Q69: Using _,it was observed that bath temperature,wave
Q70: Which of the following is NOT a
Q73: If a normal random variable has a
Q75: Distributions with values of coefficient of kurtosis
Q76: Briefly discuss the relation between exponential distribution
Q76: A manager was assigned the task of
Q91: The collection of all possible outcomes of