Essay
Use the graph shown to answer the following questions.Put the correct letter(s)in the blank. 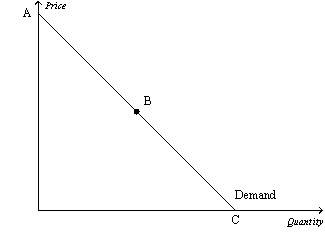
a.The elastic section of the graph is represented by section from _______.
b.The inelastic section of the graph is represented by section from _______.
c.The unit elastic section of the graph is represented by section _______.
d.The portion of the graph in which a decrease in price would cause total revenue to fall would be from _________.
e.The portion of the graph in which a decrease in price would cause total revenue to rise would be from _________.
f.The portion of the graph in which a decrease in price would not cause a change in total revenue would be _________.
g.The section of the graph in which total revenue would be at a maximum would be _______.
h.The section of the graph in which elasticity is greater than 1 is _______.
i.The section of the graph in which elasticity is equal to 1 is ______.
j.The section of the graph in which elasticity is less than 1 is _______.
Correct Answer:

Verified
a.
A to B
b.
B to C
...View Answer
Unlock this answer now
Get Access to more Verified Answers free of charge
Correct Answer:
Verified
A to B
b.
B to C
...
View Answer
Unlock this answer now
Get Access to more Verified Answers free of charge
Q23: For a particular good, a 3 percent
Q73: Which of the following was not a
Q108: When the Shaffers had a monthly income
Q150: Figure 5-11 <img src="https://d2lvgg3v3hfg70.cloudfront.net/TB4796/.jpg" alt="Figure 5-11
Q151: Table 5-6<br> <img src="https://d2lvgg3v3hfg70.cloudfront.net/TB4796/.jpg" alt="Table 5-6
Q152: Suppose the price elasticity of supply for
Q154: Figure 5-4 <img src="https://d2lvgg3v3hfg70.cloudfront.net/TB4796/.jpg" alt="Figure 5-4
Q159: Between 1950 and 2008 there was a<br>A)
Q280: Which of the following expressions can be
Q493: Figure 5-6<br> <img src="https://d2lvgg3v3hfg70.cloudfront.net/TB2185/.jpg" alt="Figure 5-6