Multiple Choice
Figure 5-12
The following figure shows the supply curve for a particular good. 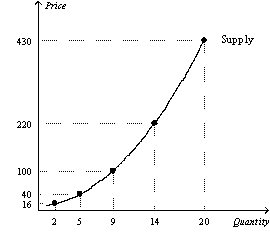
-Refer to Figure 5-12.Over which range is the supply curve in this figure the most elastic?
A) Between $16 and $40
B) Between $40 and $100
C) Between $100 and $220
D) Between $220 and $430
Correct Answer:

Verified
Correct Answer:
Verified
Q3: When studying how some event or policy
Q12: Necessities such as food and clothing tend
Q39: Goods with many close substitutes tend to
Q42: Under which of the following conditions would
Q87: Figure 5-8<br> <img src="https://d2lvgg3v3hfg70.cloudfront.net/TB2185/.jpg" alt="Figure 5-8
Q105: In which of the following situations will
Q133: Cross-price elasticity is used to determine whether
Q167: There are fewer farmers in the United
Q169: Figure 5-12<br>The following figure shows the supply
Q173: Demand is said to be unit elastic