Multiple Choice
Figure 5-12
The following figure shows the supply curve for a particular good. 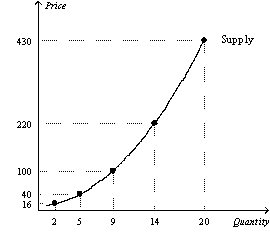
-Refer to Figure 5-12.Over which range is the supply curve in this figure the least elastic?
A) Between $16 and $40
B) Between $40 and $100
C) Between $100 and $220
D) Between $220 and $430
Correct Answer:

Verified
Correct Answer:
Verified
Q32: Which of the following statements helps to
Q61: If the quantity supplied is the same
Q101: When the price of knee braces increased
Q165: The supply of a good will be
Q215: Figure 5-4 <img src="https://d2lvgg3v3hfg70.cloudfront.net/TB2297/.jpg" alt="Figure 5-4
Q244: An increase in price causes an increase
Q246: An increase in the price of pure
Q248: If the price elasticity of demand is
Q249: If the price elasticity of supply is
Q250: The value of the price elasticity of