Multiple Choice
Figure 5-12
The following figure shows the supply curve for a particular good. 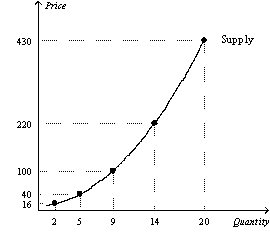
-Refer to Figure 5-12.Using the midpoint method,what is the price elasticity of supply between $16 and $40?
A) 0.125
B) 0.86
C) 1.0
D) 2.5
Correct Answer:

Verified
Correct Answer:
Verified
Q1: In general,elasticity is a measure of<br>A)the extent
Q33: A decrease in supply will cause the
Q96: Figure 5-4 <img src="https://d2lvgg3v3hfg70.cloudfront.net/TB2297/.jpg" alt="Figure 5-4
Q249: Food and clothing tend to have<br>A)small income
Q249: If the price elasticity of supply is
Q250: The value of the price elasticity of
Q251: Figure 5-15 <img src="https://d2lvgg3v3hfg70.cloudfront.net/TB4796/.jpg" alt="Figure 5-15
Q255: Consider airfares on flights between New York
Q259: Suppose the price elasticity of supply for
Q271: Figure 5-4 <img src="https://d2lvgg3v3hfg70.cloudfront.net/TB2297/.jpg" alt="Figure 5-4