Multiple Choice
Figure 10-10 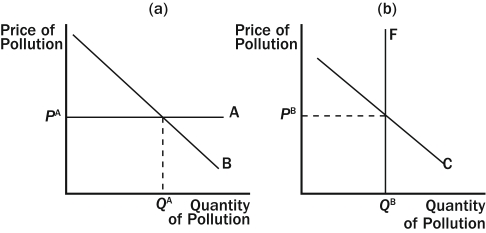
-Refer to Figure 10-10.Which graph illustrates a pollution permit program?
A) the left graph
B) the right graph
C) both graphs
D) neither graph
Correct Answer:

Verified
Correct Answer:
Verified
Related Questions
Q15: Buyers and sellers neglect the external effects
Q71: Which of the following statements about a
Q77: Why are efficiency taxes preferred to regulatory
Q99: Suppose that elementary education creates a positive
Q232: Assuming transaction costs are small,the Coase theorem
Q256: Figure 10-5 <img src="https://d2lvgg3v3hfg70.cloudfront.net/TB1273/.jpg" alt="Figure 10-5
Q311: Private markets fail to reach a socially
Q343: The Coase theorem suggests that private solutions
Q385: When an industry is characterized by technology
Q459: Private solutions may not be possible due