Multiple Choice
Figure 18-1.On the graph,L represents the quantity of labor and Q represents the quantity of output per week. 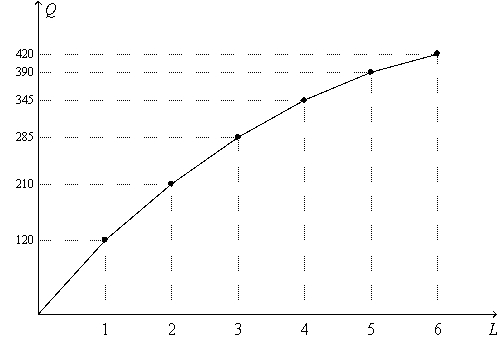
-Refer to Figure 18-1.Suppose the firm sells its output for $15 per unit,and it pays each of its workers $750 per week.When output increases from 210 units to 285 units,
A) the marginal cost is $10 per unit of output.
B) the marginal revenue is $5 per unit of output.
C) the value of the marginal product of labor is $4,275
D) the firm's profit decreases.
Correct Answer:

Verified
Correct Answer:
Verified
Q191: When a firm maximizes profit,<br>A) it will
Q192: For a competitive firm experiencing diminishing marginal
Q194: How much of the income in the
Q198: Table 18-5<br> <img src="https://d2lvgg3v3hfg70.cloudfront.net/TB4796/.jpg" alt="Table 18-5
Q199: Competitive firms that maximize profit will hire
Q224: In a competitive market for labor, the
Q235: An increase in population can be expected
Q240: A profit-maximizing, competitive firm for which the
Q286: Which of the following statements is correct?<br>A)Neither
Q539: Consider the labor market for computer programmers.