Multiple Choice
Figure 18-2.The figure shows a particular firm's value-of-marginal-product (VMP) curve.On the horizontal axis,L represents the number of workers.The time frame is daily. 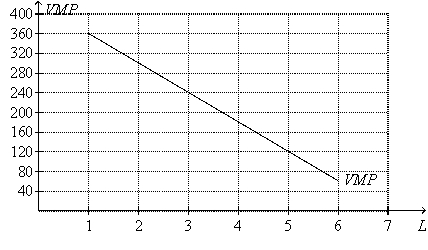
-Refer to Figure 18-2.Suppose one point on the firm's production function is
(L = 3,Q = 180) ,where L = number of workers and Q = quantity of output.If the firm sells its output for $5 per unit,then
A) a second point on the firm's production function is (L = 4,Q = 216) .
B) the firm's production function exhibits the property of diminishing marginal product of labor.
C) the firm will maximize profit by hiring four workers if it pays workers $160 per day.
D) All of the above are correct.
Correct Answer:

Verified
Correct Answer:
Verified
Q73: A competitive firm will hire workers up
Q94: To compute the value of the marginal
Q95: A competitive firm sells its output for
Q98: Suppose the following events occur in the
Q100: Dave is the owner of Dave's Pizza
Q101: Figure 18-6 <img src="https://d2lvgg3v3hfg70.cloudfront.net/TB4796/.jpg" alt="Figure 18-6
Q103: Figure 18-7 <img src="https://d2lvgg3v3hfg70.cloudfront.net/TB4796/.jpg" alt="Figure 18-7
Q104: Labor-augmenting technology causes which of the following?<br><img
Q143: A change in the supply of any
Q189: Using the theory of wage determination, explain