Multiple Choice
Figure 18-2.The figure shows a particular firm's value-of-marginal-product (VMP) curve.On the horizontal axis,L represents the number of workers.The time frame is daily. 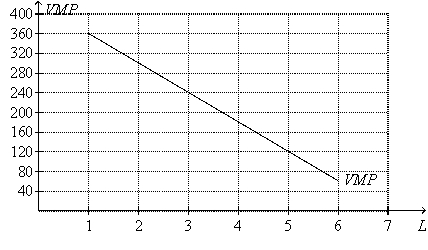
-Refer to Figure 18-2.Assume the following:
• Two points on the firm's production function are (L = 2,Q = 180) and (L = 3,Q = 228) ,
Where L = number of workers and Q = quantity of output.
• The firm pays its workers $120 per day.
• The firm's non-labor costs are fixed and they amount to $250 per day.
We can conclude that
A) the firm sells its output for $12 per unit.
B) if the firm is currently employing 2 workers per day,then profit could be increased by $48 per day if a third worker is hired.
C) the marginal cost per unit of output is $2.50 when output is increased from 180 units per day to 228 units per day.
D) the firm's maximum profit occurs when it hires 3 workers per day.
Correct Answer:

Verified
Correct Answer:
Verified
Q22: A profit-maximizing competitive firm will hire workers
Q103: Which of the following events would lead
Q105: Table 18-3<br> <img src="https://d2lvgg3v3hfg70.cloudfront.net/TB4796/.jpg" alt="Table 18-3
Q106: Figure 18-2.The figure shows a particular firm's
Q108: For a worker,the opportunity cost of an
Q109: The basic tools of supply and demand
Q112: Table 18-2<br>The following table shows the production
Q113: Table 18-3<br> <img src="https://d2lvgg3v3hfg70.cloudfront.net/TB4796/.jpg" alt="Table 18-3
Q138: If the demand curve for beef shifts
Q232: If the marginal productivity of the sixth