Multiple Choice
Figure 18-4
This figure below shows the labor market for automobile workers.The curve labeled S is the labor supply curve,and the curves labeled D1 and D2 are the labor demand curves.On the horizontal axis,L represents the quantity of labor in the market. 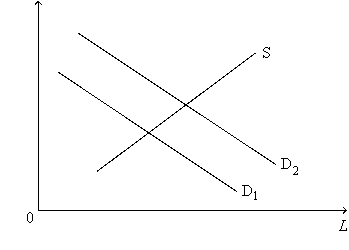
-Refer to Figure 18-4.Which of the following events would most likely explain the shift of the labor-demand curve from D1 to D2?
A) The price of automobiles decreased.
B) A large number of immigrants entered the automobile-worker market.
C) A technological advance increased the marginal product of automobile workers.
D) All of the above events are equally-likely explanations.
Correct Answer:

Verified
Correct Answer:
Verified
Q91: Explain how a firm values the contribution
Q198: Labor supply curves are always upward sloping.
Q199: Suppose an influenza pandemic were to significantly
Q203: Figure 18-5 <img src="https://d2lvgg3v3hfg70.cloudfront.net/TB4796/.jpg" alt="Figure 18-5
Q204: Labor markets are different from most other
Q206: Table 18-4<br>Consider the following daily production data
Q210: Table 18-5<br> <img src="https://d2lvgg3v3hfg70.cloudfront.net/TB4796/.jpg" alt="Table 18-5
Q211: Consider the market for land.Suppose the value
Q289: When we focus on the firm as
Q555: If the value of the marginal product