Multiple Choice
Figure 18-4
This figure below shows the labor market for automobile workers.The curve labeled S is the labor supply curve,and the curves labeled D1 and D2 are the labor demand curves.On the horizontal axis,L represents the quantity of labor in the market. 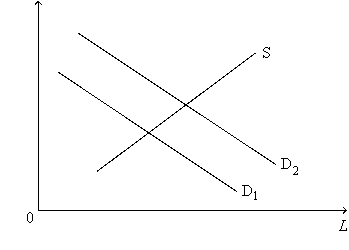
-Refer to Figure 18-4.Which of the following events would most likely explain a shift of the labor-demand curve from D2 back to D1?
A) The price of automobiles decreased.
B) A large number of immigrants entered the automobile-worker market.
C) A technological advance increased the marginal product of automobile workers.
D) An increase in the demand for automobiles.
Correct Answer:

Verified
Correct Answer:
Verified
Q33: If Firm X is a competitive firm
Q34: An increase in the supply of labor
Q144: Diminishing marginal product occurs when<br>A) the increases
Q146: Labor-saving technology causes which of the following?<br><img
Q151: Suppose that a competitive firm hires labor
Q153: Table 18-4<br>Consider the following daily production data
Q187: Diminishing marginal product is closely related to<br>A)diminishing
Q261: Value of marginal product is defined as
Q262: Consider the labor market for computer programmers.
Q409: Suppose that a new invention decreases the