Multiple Choice
Figure 21-3
In each case,the budget constraint moves from BC-1 to BC-2. 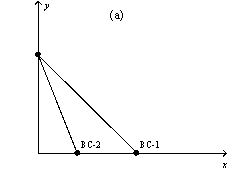
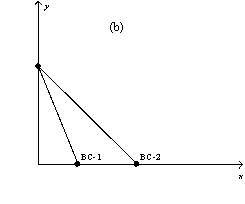
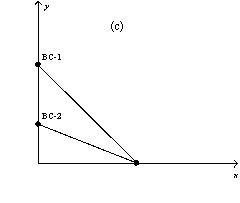
-Refer to Figure 21-3.Which of the graphs in the figure could reflect a decrease in the prices of both goods?
A) graph a
B) graph b
C) graph c
D) None of the above is correct.
Correct Answer:

Verified
Correct Answer:
Verified
Q2: The direction of the substitution effect is
Q160: If the price of hamburgers increases,the substitution
Q161: Figure 21-9 <img src="https://d2lvgg3v3hfg70.cloudfront.net/TB4796/.jpg" alt="Figure 21-9
Q167: The following diagram shows one indifference curve
Q168: Dave consumes two normal goods,X and Y,and
Q169: The following diagram shows two budget lines:
Q170: Each of the following are characteristics of
Q429: Karen,Tara,and Chelsea each buy ice cream and
Q440: Both Diana and Sarah like jazz music
Q497: Karen, Tara, and Chelsea each buy ice