Multiple Choice
Figure 21-8 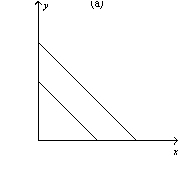
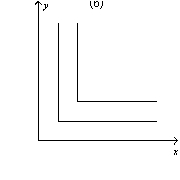
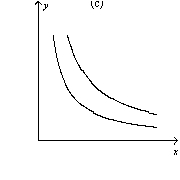
-Refer to Figure 21-8.Which of the graphs shown represent indifference curves for perfect complements?
A) graph a
B) graph b
C) graph c
D) All of the above are correct.
Correct Answer:

Verified
Correct Answer:
Verified
Related Questions
Q75: As long as a consumer remains on
Q120: Suppose that you have $100 today and
Q124: If the relative price of a concert
Q149: The income effect of a price change
Q207: If a consumer purchases more of good
Q251: Figure 21-2 The downward-sloping line on the
Q287: The consumer's optimum is where<br>A) MU<sub>x</sub>/MU<sub>y</sub> =
Q290: Figure 21-12 <img src="https://d2lvgg3v3hfg70.cloudfront.net/TB4796/.jpg" alt="Figure 21-12
Q295: Jake faces tradeoffs between consuming in the
Q297: Jonathan is planning ahead for retirement and