Multiple Choice
Figure 21-8 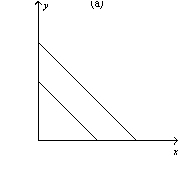
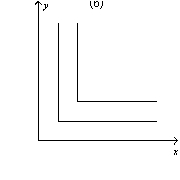
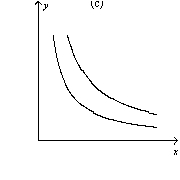
-Refer to Figure 21-8.Which of the graphs shown represent indifference curves for perfect substitutes?
A) graph a
B) graph b
C) graph c
D) All of the above are correct.
Correct Answer:

Verified
Correct Answer:
Verified
Related Questions
Q26: A consumer consumes two normal goods,pretzels and
Q33: Assume that a college student spends her
Q65: When two goods are perfect substitutes, the
Q125: The substitution effect of a price change
Q180: Evaluate the following statement, "Warren Buffet is
Q188: Figure 21-1<br> <img src="https://d2lvgg3v3hfg70.cloudfront.net/TB2185/.jpg" alt="Figure 21-1
Q339: Diana and Sarah each like jewelry and
Q377: Consider two goods,books and hamburgers.The slope of
Q444: We can use the theory of consumer
Q514: Suppose a consumer spends her income on