Multiple Choice
Figure 21-11 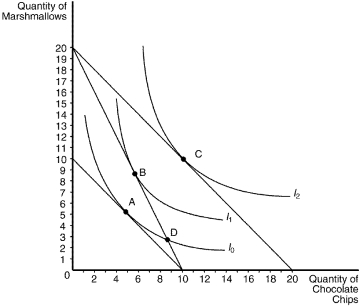
-Refer to Figure 21-11.Assume that the consumer depicted the figure has an income of $50.Based on the information available in the graph,which of the following price-quantity combinations would be on her demand curve for marshmallows if the price of chocolate chips is $2.50?
A) P=$2.50,Q=6
B) P=$2.50,Q=10
C) P=$5.00,Q=3
D) P=$5.00,Q=5
Correct Answer:

Verified
Correct Answer:
Verified
Q19: At a consumer's optimal choice, the consumer
Q136: Assume that a consumer's indifference curve is
Q141: If we observe that a consumer's budget
Q151: When a consumer is purchasing the best
Q151: A consumer has preferences over two goods:
Q153: An increase in income will cause a
Q157: Jeffrey spends all of his income on
Q160: If the price of hamburgers increases,the substitution
Q161: Figure 21-9 <img src="https://d2lvgg3v3hfg70.cloudfront.net/TB4796/.jpg" alt="Figure 21-9
Q399: Suppose that for Emily, DVDs and trips