Multiple Choice
Figure 34-3. 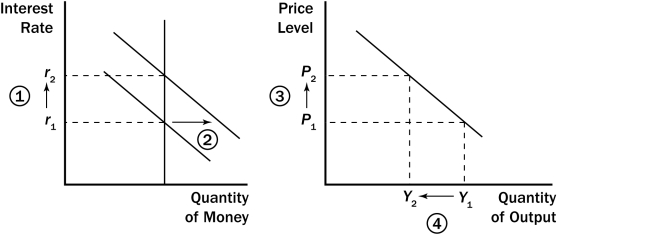
-Refer to Figure 34-3.What quantity is represented by the vertical line on the left-hand graph?
A) the supply of money
B) the demand for money
C) the rate of inflation
D) the quantity of bonds that was most recently sold or purchased by the Federal Reserve
Correct Answer:

Verified
Correct Answer:
Verified
Q12: In the graph of the money market,the
Q16: With respect to their impact on aggregate
Q46: A tax cut shifts aggregate demand<br>A)by more
Q73: Figure 34-2.On the left-hand graph,MS represents the
Q76: Figure 34-5.On the left-hand graph,MS represents the
Q81: If expected inflation is constant and the
Q117: Suppose there were a large increase in
Q140: According to the liquidity preference theory, an
Q159: According to the theory of liquidity preference,which
Q214: If Congress cuts spending to balance the