Multiple Choice
Figure 34-4.On the figure,MS represents money supply and MD represents money
demand. 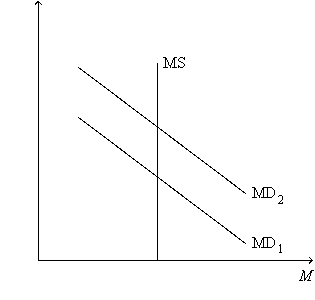
-Refer to Figure 34-4.What is measured along the vertical axis of the graph?
A) the quantity of output
B) the amount of crowding out
C) the interest rate
D) the price level
Correct Answer:

Verified
Correct Answer:
Verified
Related Questions
Q16: According to the theory of liquidity preference,
Q22: The Kennedy tax cut of 1964 was<br>A)successful
Q100: Which among the following assets is the
Q116: According to the theory of liquidity preference,an
Q157: Other things the same,a decrease in the
Q175: If households view a tax cut as
Q198: If expected inflation is constant, then when
Q236: Which of the following actions might we
Q325: Assume the MPC is 0.625. Assuming only
Q349: A decrease in the interest rate could