Multiple Choice
Figure 35-4
Use the graph below to answer the following questions. 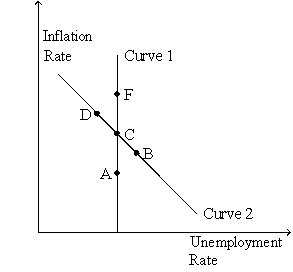
-Refer to Figure 35-4.Curve 1 is the
A) long-run aggregate supply curve.
B) short-run aggregate supply curve.
C) long-run Phillips curve.
D) short-run Phillips curve.
Correct Answer:

Verified
Correct Answer:
Verified
Related Questions
Q10: In the long run,<br>A)the natural rate of
Q19: An adverse supply shock will cause output<br>A)and
Q34: Which of the following would not be
Q50: The Phillips curve and the short-run aggregate
Q76: There is a<br>A)short-run tradeoff between inflation and
Q81: According to Friedman and Phelps,policymakers face a
Q135: Figure 35-4<br>Use the graph below to answer
Q137: The economy will move to a point
Q138: In the long run,a decrease in the
Q373: Suppose that the money supply increases. In