Saving-Investment Diagram -Based on the Saving-Investment Diagram,if the Difference Between Values G
Multiple Choice
Saving-Investment Diagram 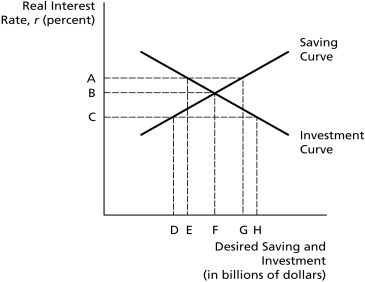
-Based on the Saving-Investment Diagram,if the difference between values G and E measures the net capital outflow,then ________.
A) the difference between values G and E measures the trade surplus
B) the difference between values H and D measures the trade surplus
C) the domestic real interest rate is indicated by B
D) desired saving has decreased
E) none of the above
Correct Answer:

Verified
Correct Answer:
Verified
Q11: If policymakers in an open economy want
Q12: Saving-Investment Diagram <img src="https://d2lvgg3v3hfg70.cloudfront.net/TB5036/.jpg" alt="Saving-Investment Diagram
Q13: The real interest rate _.<br>A)is the cost
Q14: A small open economy would typically enjoy
Q15: In the long run,if government increases spending
Q17: In an economy open to international trade
Q18: When an economy becomes attractive to global
Q19: In an open economy,Y = C +
Q20: Ceteris paribus,in a closed economy,if consumers become
Q21: Saving-Investment Diagram <img src="https://d2lvgg3v3hfg70.cloudfront.net/TB5036/.jpg" alt="Saving-Investment Diagram