Essay
Solow Diagram 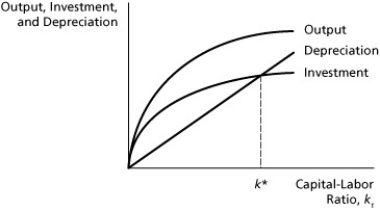
-On the diagram above,show the new steady-state capital-labor ratio that results from a decrease in the saving rate.Can you say what has happened to the equilibrium level of consumption per worker?
Correct Answer:

Verified
As saving/investment falls,the equilibri...View Answer
Unlock this answer now
Get Access to more Verified Answers free of charge
Correct Answer:
Verified
View Answer
Unlock this answer now
Get Access to more Verified Answers free of charge
Q25: In the Solow model,which of the following
Q26: Solow Diagram <img src="https://d2lvgg3v3hfg70.cloudfront.net/TB5036/.jpg" alt="Solow Diagram
Q27: Evidence of a negative correlation between income
Q28: If the contribution from capital growth equals
Q29: On the Solow Diagram,an increase in the
Q31: The loss of capital due to the
Q32: The Solow model implies that continuous growth
Q33: Figure 6.1 <img src="https://d2lvgg3v3hfg70.cloudfront.net/TB5036/.jpg" alt="Figure 6.1
Q34: If an economy initially starts away from
Q35: Which of the following is the most