Multiple Choice
IS Graph 2 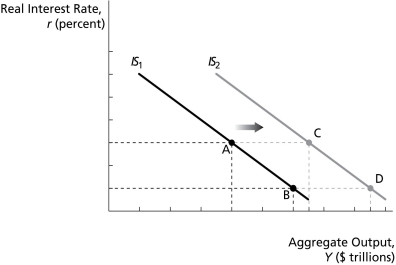
-On the graph above,if the economy is at point A when the real interest rate falls,the economy's new situation might be indicated by point ________.
A) A
B) B
C) C
D) D
E) none of the above
Correct Answer:

Verified
Correct Answer:
Verified
Q70: According to the IS equation,a change in
Q71: The difference between the interest rate on
Q72: IS Graph 1 <img src="https://d2lvgg3v3hfg70.cloudfront.net/TB5036/.jpg" alt="IS Graph
Q73: If the government cuts taxes _.<br>A)disposable income
Q74: IS Graph 1 <img src="https://d2lvgg3v3hfg70.cloudfront.net/TB5036/.jpg" alt="IS Graph
Q76: In a stock market boom _.<br>A)autonomous consumption
Q77: An increase in autonomous investment _.<br>A)increases equilibrium
Q78: A decrease in autonomous investment _.<br>A)decreases equilibrium
Q79: If aggregate output is below its equilibrium
Q80: A decrease in autonomous consumption _.<br>A)raises planned