Multiple Choice
IS Graph 2 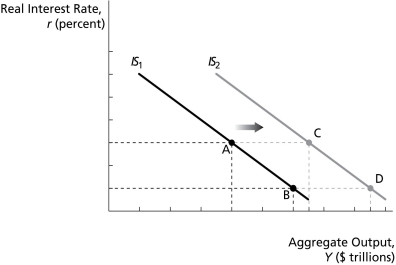
-On the graph above,if the U.S.economy is at point B in 2009,then the economy in 2010 is best represented by point ________.
A) A
B) B
C) C
D) D
E) any of the labeled points is as good as the others
Correct Answer:

Verified
Correct Answer:
Verified
Q1: Fixed investment is typically _.<br>A)smaller than inventory
Q3: IS Curve Exogenous Variables and Parameters<br>Table 2
Q4: In the IS curve,if Y falls for
Q5: IS Graph 2 <img src="https://d2lvgg3v3hfg70.cloudfront.net/TB5036/.jpg" alt="IS Graph
Q6: Net exports _.<br>A)are heavily determined by foreign
Q7: IS Graph 1 <img src="https://d2lvgg3v3hfg70.cloudfront.net/TB5036/.jpg" alt="IS Graph
Q8: In the IS model,assuming that the real
Q9: In the IS equation,which of the following
Q10: If planned expenditure is below output,as the
Q11: IS Graph 1 <img src="https://d2lvgg3v3hfg70.cloudfront.net/TB5036/.jpg" alt="IS Graph