Multiple Choice
Aggregate Demand and Supply Analysis 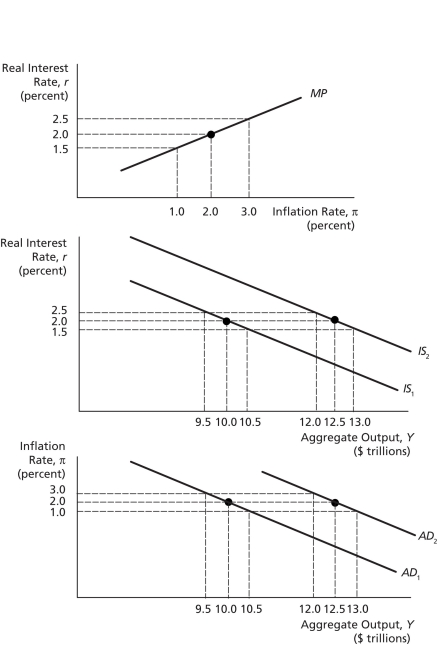
-In the figure above,assume that output is $10.5 trillion,while potential output is $12 trillion.Suppose that a combination of fiscal stimulus and recovery of consumer and business confidence shifts the IS and AD curves,as shown in the figure,while monetary policy sets the real interest rate at one percent.If the short-run aggregate supply curve is π = 
Y - 13,then the resulting values of output and inflation are ________.
A) $12 trillion & 3 percent
B) $13.5 trillion & 5 percent
C) $9.75 trillion & 0 percent
D) $13.5 trillion & 0 percent
E) $12.5 trillion & 2 percent
Correct Answer:

Verified
Correct Answer:
Verified
Q60: Aggregate Demand and Supply Analysis <img src="https://d2lvgg3v3hfg70.cloudfront.net/TB5036/.jpg"
Q61: According to the Taylor rule,which of the
Q62: Many borrowers defaulted on subprime mortgages ultimately
Q63: A negative shock in aggregate demand will
Q64: When a temporary negative supply shock hits
Q66: An increase in financial frictions results in
Q67: Some central banks pursue price stability before
Q68: If the economy is in a long-run
Q69: Nonactivists believe that _.<br>A)there is a very
Q70: The American Recovery and Reinvestment Act of