menu-iconExamlexExamLexServices

Discover

Ask a Question
  1. All Topics
  2. Topic
    Business
  3. Study Set
    Macroeconomics Policy and Practice
  4. Exam
    Exam 13: Macroeconomic Policy and Aggregate Demand and Supply Analysis
  5. Question
    Figure 13.1 -In Figure 13.1,"the Zero Lower Bound" Is Displayed at ________
Solved

Figure 13.1 -In Figure 13.1,"the Zero Lower Bound" Is Displayed at ________

Question 79

Question 79

Multiple Choice

Figure 13.1 Figure 13.1   -In Figure 13.1, the zero lower bound  is displayed at ________. A) point 1 B) point 2 C)    D) the origin (intersection of the axes)  E) none of the above
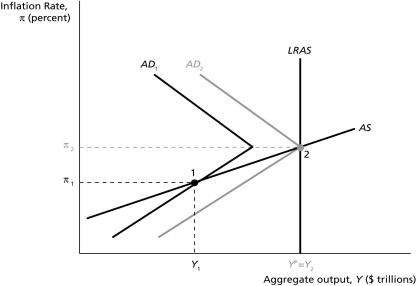
-In Figure 13.1,"the zero lower bound" is displayed at ________.


A) point 1
B) point 2
C) Figure 13.1   -In Figure 13.1, the zero lower bound  is displayed at ________. A) point 1 B) point 2 C)    D) the origin (intersection of the axes)  E) none of the above
D) the origin (intersection of the axes)
E) none of the above

Correct Answer:

verifed

Verified

Unlock this answer now
Get Access to more Verified Answers free of charge

Related Questions

Q74: A change in the equilibrium real interest

Q75: If most shocks to the economy are

Q76: The goal of maximum sustainable employment is

Q77: Many borrowers defaulted on subprime mortgages ultimately

Q78: In the absence of financial frictions,_.<br>A)interest rates

Q80: Is the Taylor rule compatible with a

Q81: Since 2010,the federal funds rate has been

Q82: Every six weeks,the Federal Open Market Committee

Q83: In recent decades,the trend among central banks

Q84: Nonconventional monetary policy attempts to reduce financial

Examlex

ExamLex

About UsContact UsPerks CenterHomeschoolingTest Prep

Work With Us

Campus RepresentativeInfluencers

Links

FaqPricingChrome Extension

Download The App

Get App StoreGet Google Play

Policies

Privacy PolicyTerms of ServiceHonor CodeCommunity Guidelines

Scan To Download

qr-code

Copyright © (2025) ExamLex LLC.

Privacy PolicyTerms Of ServiceHonor CodeCommunity Guidelines