Essay
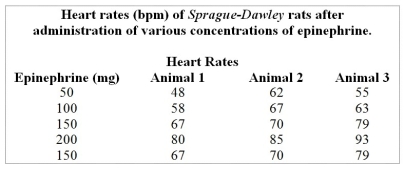
Table 1.1
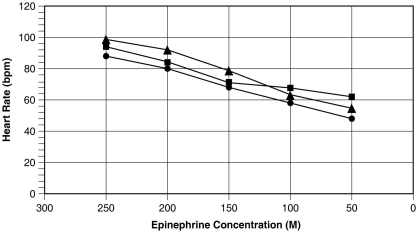
Figure 1.1
Use the table and graph below to answer the following questions.
-Summarize the data shown in Figure 1.2.
Correct Answer:

Verified
The systolic pressure of both genders in...View Answer
Unlock this answer now
Get Access to more Verified Answers free of charge
Correct Answer:
Verified
The systolic pressure of both genders in...
View Answer
Unlock this answer now
Get Access to more Verified Answers free of charge
Related Questions
Q10: A horse runs 10 races, each a
Q11: Why is it necessary to space grid
Q12: Write a teleological explanation for why heart
Q13: Physiology is the study of<br>A) the structure
Q14: You are designing a study to assess
Q16: A technique used to resolve contradictory results
Q17: Table 1.1<br> <img src="https://d2lvgg3v3hfg70.cloudfront.net/TB1120/.jpg" alt="Table 1.1
Q18: You conduct an experiment on twenty 18-year-old
Q19: Following is a table of data collected
Q20: The vasodilation of blood vessels surrounding muscles