Multiple Choice
Figure 1.1 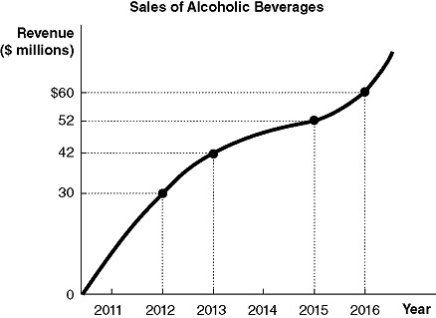
-Refer to Figure 1-1.Using the information in the figure above,calculate the percentage change in revenue from alcoholic beverage sales between 2013 and 2015.
A) 23.8%
B) 40%
C) 42.9%
D) 73.3%
Correct Answer:

Verified
Correct Answer:
Verified
Related Questions
Q103: Fiona shares an office with her ex-husband.Her
Q104: Of the following examples,which would most likely
Q105: In economics,the total amount received for selling
Q106: Trade-offs force society to make choices when
Q107: Human capital refers to the accumulated skills
Q109: Which of the following is an example
Q110: A university must decide if it should
Q111: Which of the following statements about positive
Q112: In 2017,Peelville consumed 30,000 bananas.In 2018,banana consumption
Q113: Which of the following contributed to the