Figure 2-3 -Refer to Figure 2-3.Carlos Vanya Grows Tomatoes and Strawberries on and Strawberries
Multiple Choice
Figure 2-3 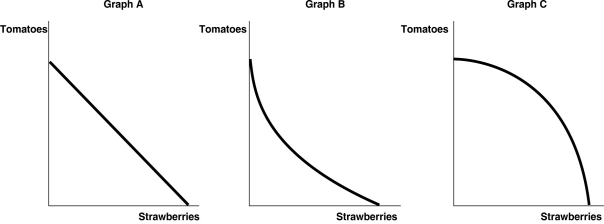
-Refer to Figure 2-3.Carlos Vanya grows tomatoes and strawberries on his land.A portion of his land is more suitable for growing tomatoes and the other portion is better suited for strawberry cultivation.Which of the graphs in Figure 2-3 represent his production possibilities frontier?
A) Graph A
B) Graph B
C) Graph C
D) either Graph A or Graph B
E) either Graph B or Graph C
Correct Answer:

Verified
Correct Answer:
Verified
Q19: Table 2-6<br> <img src="https://d2lvgg3v3hfg70.cloudfront.net/TB1236/.jpg" alt="Table 2-6
Q20: Figure 2-9 <img src="https://d2lvgg3v3hfg70.cloudfront.net/TB1236/.jpg" alt="Figure 2-9
Q21: Table 2-1<br>Production Choices for Dina's Diner<br> <img
Q22: A successful market economy requires well defined
Q23: Table 2-6<br> <img src="https://d2lvgg3v3hfg70.cloudfront.net/TB1236/.jpg" alt="Table 2-6
Q25: If you can produce more of something
Q26: Table 2-1<br>Production Choices for Dina's Diner<br> <img
Q27: In the circular flow model,households demand resources
Q28: A guild is<br>A)a group of independent producers
Q29: How are efficiency and inefficiency represented on