Multiple Choice
Figure 2-9 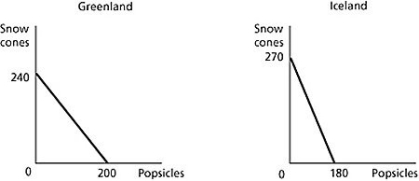 Figure 2-9 shows the production possibilities frontiers for Greenland and Iceland.Each country produces two goods,snow cones and popsicles.
-Refer to Figure 2-9.What is the opportunity cost of producing 1 snow cone in Greenland?
A) 2/3 of a popsicle
B) 5/6 of a popsicle
C) 1 1/5 popsicles
D) 200 popsicles
Correct Answer:

Verified
Correct Answer:
Verified
Q140: Figure 2-6 <img src="https://d2lvgg3v3hfg70.cloudfront.net/TB1236/.jpg" alt="Figure 2-6
Q141: For each watch that Switzerland produces,it gives
Q142: Table 2-9<br> <img src="https://d2lvgg3v3hfg70.cloudfront.net/TB1236/.jpg" alt="Table 2-9
Q143: Figure 2-8 <img src="https://d2lvgg3v3hfg70.cloudfront.net/TB1236/.jpg" alt="Figure 2-8
Q144: The _ production points on a production
Q146: Figure 2-2 <img src="https://d2lvgg3v3hfg70.cloudfront.net/TB1236/.jpg" alt="Figure 2-2
Q147: If opportunity costs are _,the production possibilities
Q148: Any output combination inside a production possibilities
Q149: Table 2-2<br>Production choices for Nadia's Neckware<br> <img
Q150: Figure 2-2 <img src="https://d2lvgg3v3hfg70.cloudfront.net/TB1236/.jpg" alt="Figure 2-2