Multiple Choice
Figure 3-1 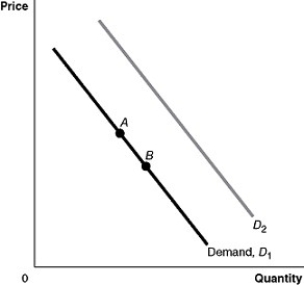
-Refer to Figure 3-1.An increase in taste or preference would be represented by a movement from
A) A to B.
B) B to A.
C) D1 to D2.
D) D2 to D1.
Correct Answer:

Verified
Correct Answer:
Verified
Related Questions
Q118: Table 3-2<br> <img src="https://d2lvgg3v3hfg70.cloudfront.net/TB1236/.jpg" alt="Table 3-2
Q119: For each of the following pairs of
Q120: Figure 3-6 <img src="https://d2lvgg3v3hfg70.cloudfront.net/TB1236/.jpg" alt="Figure 3-6
Q121: In most countries in South America,the legal
Q122: An increase in the equilibrium price for
Q124: Studies have shown that smoking cigarettes can
Q125: A(n)_ is represented by a rightward shift
Q126: In recent years,the demand for orange juice
Q127: If the quantity demanded for a product
Q128: Cole was discussing the market for cocoa