Multiple Choice
Figure 3-3 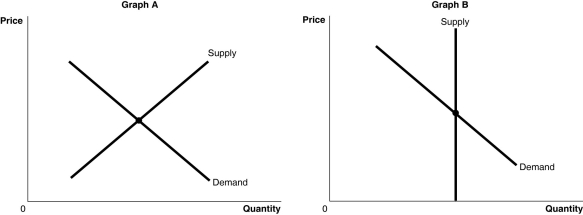
-Refer to Figure 3-3.The figure above shows the supply and demand curves for two markets: the market for original Michelangelo sculptures and the market for Ray Ban sunglasses.Which graph most likely represents which market?
A) Graph B represents the market for original Michelangelo sculptures and Graph A represents the market for Ray Ban sunglasses.
B) Graph A represents the market for original Michelangelo sculptures and Graph B represents the market for Ray Ban sunglasses.
C) Graph A represents both the market for original Michelangelo sculptures and Ray Ban sunglasses.
D) Graph B represents both the market for original Michelangelo sculptures and Ray Ban sunglasses.
Correct Answer:

Verified
Correct Answer:
Verified
Q60: If virtual reality headsets are considered substitutes
Q61: Farmers can raise either goats or ostriches
Q62: A change in quantity supplied is represented
Q63: Figure 3-5 <img src="https://d2lvgg3v3hfg70.cloudfront.net/TB1236/.jpg" alt="Figure 3-5
Q64: The _ effect of a price change
Q66: An decrease in supply is caused by
Q67: Which of the following would cause the
Q68: Figure 3-2 <img src="https://d2lvgg3v3hfg70.cloudfront.net/TB1236/.jpg" alt="Figure 3-2
Q69: Suppose that when the price of hamburgers
Q70: If a firm expects that the price