Essay
Table 8-22
2013 2018
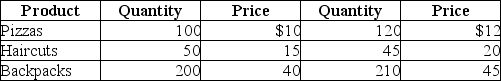
-Refer to Table 8-22.Suppose that a very simple economy produces three goods: pizzas,haircuts,and backpacks.Suppose the quantities produced and their corresponding prices for 2013 and 2018 are shown in the table above.Use the information to compute real GDP in the year 2013 and 2018.Assume that 2013 is the base year.Is output higher in 2018 or 2013? Why?
Correct Answer:

Verified
Recall that real GDP is found by valuing...View Answer
Unlock this answer now
Get Access to more Verified Answers free of charge
Correct Answer:
Verified
View Answer
Unlock this answer now
Get Access to more Verified Answers free of charge
Q7: The measure of production that values production
Q8: How are intermediate goods treated in the
Q9: National income is defined as<br>A)gross national product
Q10: Which of the following is considered a
Q11: During a business cycle expansion,total production _
Q13: If the GDP deflator is less than
Q14: Table 8-18<br> <img src="https://d2lvgg3v3hfg70.cloudfront.net/TB1236/.jpg" alt="Table 8-18
Q15: Which of the following goods is directly
Q16: Table 8-29<br> <img src="https://d2lvgg3v3hfg70.cloudfront.net/TB1236/.jpg" alt="Table 8-29
Q17: Table 8-16<br> <img src="https://d2lvgg3v3hfg70.cloudfront.net/TB1236/.jpg" alt="Table 8-16