Multiple Choice
Table 9-7
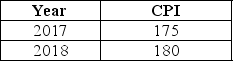
-Refer to Table 9-7.Suppose that the data in the table above reflect price levels in the economy.What is the inflation rate between 2017 and 2018?
A) 2.9%
B) 3.5%
C) 4.6%
D) 5%
E) 7.5%
Correct Answer:

Verified
Correct Answer:
Verified
Related Questions
Q180: Which of the following cause the unemployment
Q181: Frictional unemployment is the result of<br>A)a persistent
Q182: When the labor market is at full
Q183: The labor force is the sum of<br>A)employed
Q184: Unemployment caused by a business cycle recession
Q186: Table 9-10<br> <img src="https://d2lvgg3v3hfg70.cloudfront.net/TB1236/.jpg" alt="Table 9-10
Q187: Which of the following is an example
Q188: The nominal interest rate will be less
Q189: What impact would including members of the
Q190: The GDP deflator is the best measure