Multiple Choice
Table 9-8
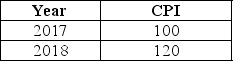
-Refer to Table 9-8.Suppose that the data in the table above reflect the price levels in the economy.What is the inflation rate in between 2017 and 2018?
A) 2%
B) 5%
C) 10%
D) 12%
E) 20%
Correct Answer:

Verified
Correct Answer:
Verified
Q274: If the minimum wage is set above
Q275: Table 9-20<br> <img src="https://d2lvgg3v3hfg70.cloudfront.net/TB1236/.jpg" alt="Table 9-20
Q276: The base period for CPI calculations is
Q277: Real interest rates at times have been
Q278: The natural rate of unemployment consists of
Q280: In the modern U.S.economy,the typical unemployed person
Q281: Which of the following labor market statistics
Q282: Efficiency wages cause unemployment because<br>A)firms pay wages
Q283: Why might firms pay wages that are
Q284: The household survey is compiled from firms