Multiple Choice
Table 9-19
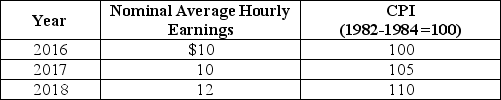
-Refer to Table 9-19.Looking at the table above,what is the rate of growth of the average price level from 2016 to 2017?
A) 1%
B) 2%
C) 3%
D) 4%
E) 5%
Correct Answer:

Verified
Correct Answer:
Verified
Related Questions
Q93: When an economy is at its natural
Q94: Which of the following policies would reduce
Q95: Suppose the working-age population of a fictional
Q96: Table 9-17<br> <img src="https://d2lvgg3v3hfg70.cloudfront.net/TB1236/.jpg" alt="Table 9-17
Q97: The Bureau of Labor Statistics would categorize
Q99: Which of the following would be the
Q100: In 2006,before the start of the recession,the
Q101: Housing is the largest component of the
Q102: The producer price index measures the prices
Q103: Which of the following individuals would be