Multiple Choice
Table 9-19
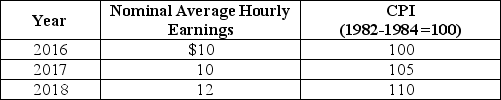
-Refer to Table 9-19.Looking at the table above,what is the rate of growth of the average price level from 2017 to 2018?
A) 1%
B) 2%
C) 3.5%
D) 4.76%
E) 5.25%
Correct Answer:

Verified
Correct Answer:
Verified
Related Questions
Q79: Which of the following policies would reduce
Q80: Discouraged workers are classified by the BLS
Q81: Fill in the missing values in the
Q82: For the last few decades,the labor force
Q83: Sarah is a full-time student who is
Q85: Unemployment arising from a persistent mismatch between
Q86: What are menu costs?<br>A)the full list of
Q87: Table 9-13<br> <img src="https://d2lvgg3v3hfg70.cloudfront.net/TB1236/.jpg" alt="Table 9-13
Q88: Using a broader measure of the unemployment
Q89: The inflation rate measures the average prices