Essay
Table 9-23
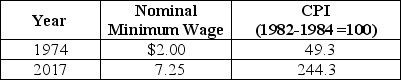
-Refer to Table 9-23.The table above lists the actual minimum wage and CPI in 1974 and in 2017.Using the above table,calculate the real minimum wage for 1974 and 2017.Calculate the rate of growth of the real minimum wage from 1974 to 2017.Are workers better off in terms of the purchasing power of a dollar in 1974 or 2017? Explain why.
Correct Answer:

Verified
The real minimum wage in 1974 is  × 100 ...
View Answer
Unlock this answer now
Get Access to more Verified Answers free of charge
Correct Answer:
Verified
View Answer
Unlock this answer now
Get Access to more Verified Answers free of charge
Q167: Emma is a road construction worker.During the
Q168: Table 9-3<br> <img src="https://d2lvgg3v3hfg70.cloudfront.net/TB1236/.jpg" alt="Table 9-3
Q169: Suppose the government launches a successful advertising
Q170: Which of the following is the smallest
Q171: If consumers purchase fewer of those products
Q173: A full-time student who is not working
Q174: If inflation is higher than expected,this helps
Q175: In recent years,economists have come to rely
Q176: In the United States,the typical person who
Q177: During the Great Depression,cyclical unemployment increased as