Multiple Choice
Figure 10-2 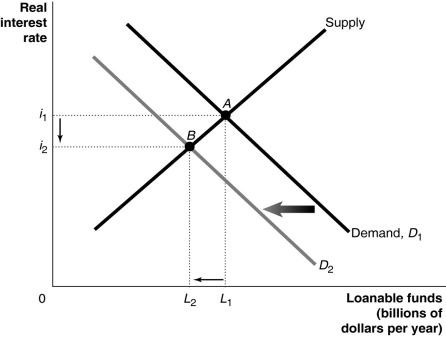
-Refer to Figure 10-2.Which of the following is consistent with the graph depicted above?
A) An expected expansion increases the profitability of new investment.
B) The government runs a budget surplus.
C) Investment spending is declining due to crowding out.
D) New government regulations decrease the profitability of new investment.
Correct Answer:

Verified
Correct Answer:
Verified
Q12: An increase in the government budget surplus
Q13: Potential GDP was estimated to grow at
Q14: A period of expansion in the business
Q15: The key to sustained economic growth is
Q16: What is the name of the organization
Q18: A government budget surplus from reduced government
Q19: In a closed economy,public saving is equal
Q20: There is a government budget surplus if<br>A)T
Q21: Which of the following increases labor productivity?<br>A)an
Q22: Scenario 10-1<br>Consider the following data for a