Multiple Choice
Figure 10-4 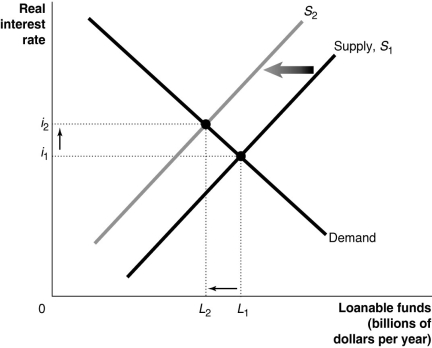
-Refer to Figure 10-4.Which of the following is consistent with the graph depicted?
A) an increase in household income
B) an increase in transfer payments to households
C) an increase in the proportion of income after net taxes used for consumption
D) an increase in tax revenues collected by the government
Correct Answer:

Verified
Correct Answer:
Verified
Q111: Economist Steve Landsburg has pointed out that
Q112: Workers in high-income countries have _ to
Q113: Table 10-2<br> <img src="https://d2lvgg3v3hfg70.cloudfront.net/TB1236/.jpg" alt="Table 10-2
Q114: Explain and show graphically how an increase
Q115: If you invest $10,000 in a bond
Q117: A recession often begins with a(n)_ in
Q118: Accumulating a greater number of inputs will
Q119: Most economists believe that the return of
Q120: If the growth rate of real GDP
Q121: The Congressional Budget Office reported that federal