Essay
Table 11-3
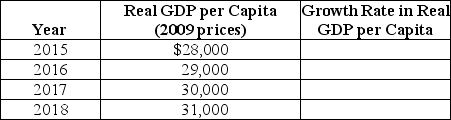
-Refer to Table 11-3.Use the table above to calculate the annual growth rate in GDP.Also calculate the total percentage change in the growth from 2015 through 2018.Explain the difference between the average annual growth rate in real per capita GDP from 2015 through 2018 and the total percentage change in growth from 2015 and 2018.
Correct Answer:

Verified
One calculates the average annual percen...View Answer
Unlock this answer now
Get Access to more Verified Answers free of charge
Correct Answer:
Verified
View Answer
Unlock this answer now
Get Access to more Verified Answers free of charge
Q171: Knowledge capital is _ in production and
Q172: Developing countries with low saving rates and
Q173: Which of the following is not a
Q174: Which of the following accurately describes the
Q175: What features made England in the eighteenth
Q177: Figure 11-3 <img src="https://d2lvgg3v3hfg70.cloudfront.net/TB1236/.jpg" alt="Figure 11-3
Q178: A policy that offers parents a tax
Q179: The opportunity cost of being unemployed tends
Q180: The economic growth model predicts that<br>A)GDP per
Q181: Technological change allows the economy to produce