Multiple Choice
Figure 13-4 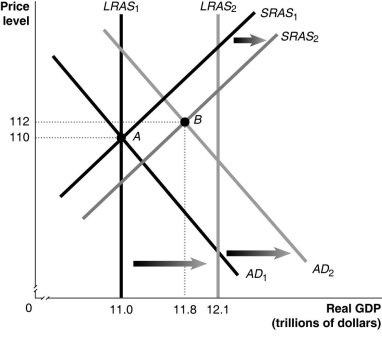
-Refer to Figure 13-4.In the figure above,AD1,LRAS1 and SRAS1 denote AD,LRAS and SRAS in year 1,while AD2,LRAS2 and SRAS2 denote AD,LRAS and SRAS in year 2.Given the economy is at point A in year 1,what is the actual growth rate in GDP in year 2?
A) 2.5%
B) 7.3%
C) 8.0%
D) 10.0%
Correct Answer:

Verified
Correct Answer:
Verified
Q190: Proponents of the real business cycle model
Q191: Hurricane Katrina resulted in a decline in
Q192: Workers expect inflation to fall from 4%
Q193: Explain how menu costs affect the slope
Q194: The process of an economy adjusting from
Q196: Which of the following is one reason
Q197: Most recessions in the United States since
Q198: Which of the following models has as
Q199: An increase in exports decreases aggregate demand.
Q200: Which of the following would cause the