Multiple Choice
Figure 15-2 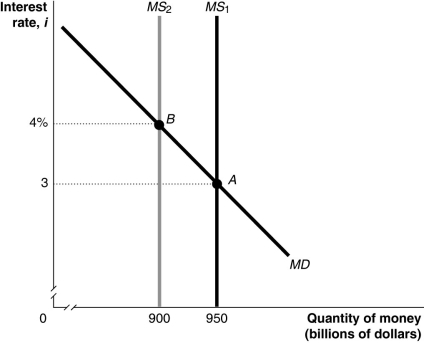
-Refer to Figure 15-2.In the figure above,the movement from point A to point B in the money market would be caused by
A) an increase in the price level.
B) a decrease in real GDP.
C) an open market sale of Treasury securities by the Federal Reserve.
D) a decrease in the required reserve ratio by the Federal Reserve.
Correct Answer:

Verified
Correct Answer:
Verified
Q263: Figure 15-12 <img src="https://d2lvgg3v3hfg70.cloudfront.net/TB1236/.jpg" alt="Figure 15-12
Q264: An increase in the demand for Treasury
Q265: In 2008,the Fed began paying banks interest
Q266: The money supply curve is vertical if<br>A)banks
Q267: Suppose the equilibrium real federal funds rate
Q269: Table 15-3<br> <img src="https://d2lvgg3v3hfg70.cloudfront.net/TB1236/.jpg" alt="Table 15-3
Q270: Lowering the interest rate will<br>A)decrease spending on
Q271: From an initial long-run macroeconomic equilibrium,if the
Q272: Table 15-8<br> <img src="https://d2lvgg3v3hfg70.cloudfront.net/TB1236/.jpg" alt="Table 15-8
Q273: Suppose you buy a house for $250,000.One