Multiple Choice
Figure 15-9 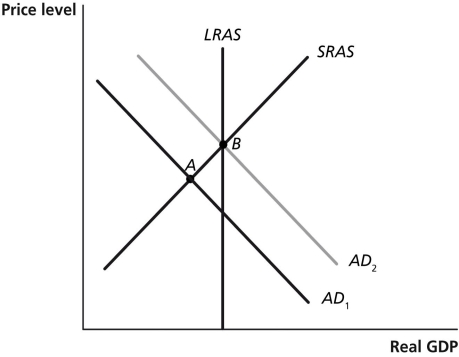
-Refer to Figure 15-9.In the figure above suppose the economy is initially at point A.The movement of the economy to point B as shown in the graph illustrates the effect of which of the following policy actions by the Federal Reserve?
A) a decrease in income taxes
B) an increase in the required reserve ratio
C) an open market purchase of Treasury bills
D) an open market sale of Treasury bills
Correct Answer:

Verified
Correct Answer:
Verified
Q162: The Federal Home Loan Mortgage Corporation and
Q163: The supporters of a monetary growth rule
Q164: Following the financial crisis of 2007-2009,banks had
Q165: If the amount you owe on your
Q166: An increase in the interest rate<br>A)decreases the
Q168: Use the dynamic aggregate demand and aggregate
Q169: The money demand curve has a negative
Q170: A decrease in interest rates can _
Q171: When housing prices _,as they did beginning
Q172: Rising prices erode the value of money