Multiple Choice
Figure 15-10 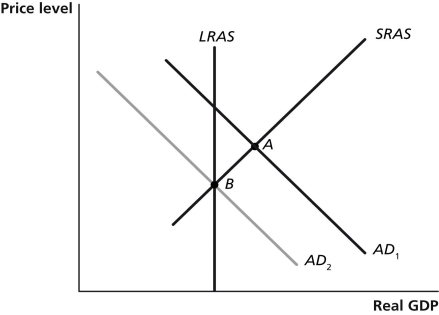
-Refer to Figure 15-10.In the figure above,suppose the economy is initially at point A.The movement of the economy to point B as shown in the graph illustrates the effect of which of the following policy actions by the Federal Reserve?
A) an increase in income taxes
B) a decrease in the required reserve ratio
C) an open market purchase of Treasury bills
D) an open market sale of Treasury bills
Correct Answer:

Verified
Correct Answer:
Verified
Q257: In June 2017,the Federal Open Market Committee
Q258: The money demand curve has a<br>A)negative slope
Q259: Maintaining a strong dollar in international currency
Q260: If the Fed orders a contractionary monetary
Q261: Would the Federal Reserve respond more aggressively
Q263: Figure 15-12 <img src="https://d2lvgg3v3hfg70.cloudfront.net/TB1236/.jpg" alt="Figure 15-12
Q264: An increase in the demand for Treasury
Q265: In 2008,the Fed began paying banks interest
Q266: The money supply curve is vertical if<br>A)banks
Q267: Suppose the equilibrium real federal funds rate