Multiple Choice
Figure 16-4 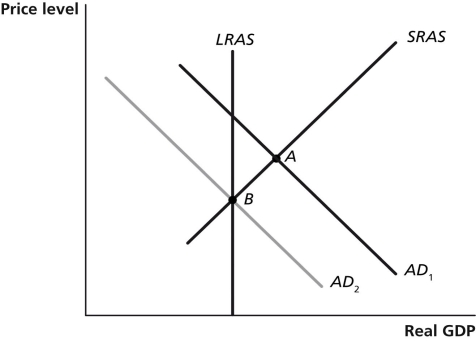
-Refer to Figure 16-4.In the graph above,suppose the economy is initially at point A.The movement of the economy to point B as shown in the graph illustrates the effect of which of the following policy actions by Congress and the president?
A) an increase in transfer payments
B) an increase in interest rates
C) an increase in the marginal income tax rate
D) an open market purchase of Treasury bills
Correct Answer:

Verified
Correct Answer:
Verified
Q108: Which of the following is an objective
Q109: Tax cuts on business income _ aggregate
Q110: Assuming a fixed amount of taxes and
Q111: The Federal Reserve plays a larger role
Q112: A law requiring the government to balance
Q114: Active changes in tax and spending by
Q115: Which of the following provides health-care coverage
Q116: The growth rate of hours worked depends
Q117: Crowding out refers to a decrease in
Q118: Suppose real GDP is $13 trillion,potential real