Multiple Choice
Figure 16-8 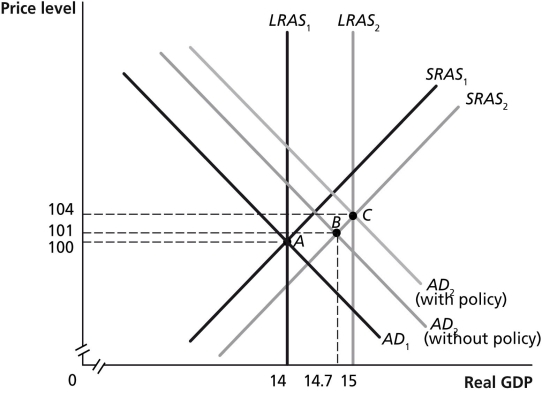
-Refer to Figure 16-8.In the graph above,suppose the economy in Year 1 is at point A and is expected in Year 2 to be at point B.Which of the following policies could Congress and the president use to move the economy to point C?
A) increase government purchases
B) decrease government purchases
C) increase income taxes
D) sell Treasury bills
Correct Answer:

Verified
Correct Answer:
Verified
Q288: Table 16-2<br> <img src="https://d2lvgg3v3hfg70.cloudfront.net/TB1236/.jpg" alt="Table 16-2
Q289: In absolute value,the tax multiplier is greater
Q290: Figure 16-1 <img src="https://d2lvgg3v3hfg70.cloudfront.net/TB1236/.jpg" alt="Figure 16-1
Q291: During 1970-1997,the U.S.federal government was<br>A)in surplus every
Q292: Crowding out refers to a decline in
Q294: The total value of U.S.Treasury bonds outstanding
Q295: A change in consumption spending caused by
Q296: Table 16-4<br> <img src="https://d2lvgg3v3hfg70.cloudfront.net/TB1236/.jpg" alt="Table 16-4
Q297: Fiscal policy actions that are intended to
Q298: Tax reduction and simplification should _ long-run