Multiple Choice
Figure 16-10 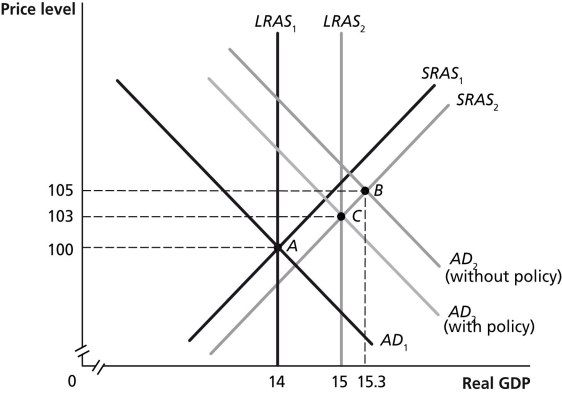
-Refer to Figure 16-10.In the graph above,suppose the economy in Year 1 is at point A and is expected in Year 2 to be at point B.Which of the following policies could Congress and the president use to move the economy to point C?
A) increase income taxes
B) increase government spending
C) buy Treasury bills
D) decrease the discount rate
Correct Answer:

Verified
Correct Answer:
Verified
Q275: Table 16-6<br> <img src="https://d2lvgg3v3hfg70.cloudfront.net/TB1236/.jpg" alt="Table 16-6
Q276: Show the impact of tax reduction and
Q277: In recent economic history,the U.S.federal budget was
Q278: Table 16-3<br> <img src="https://d2lvgg3v3hfg70.cloudfront.net/TB1236/.jpg" alt="Table 16-3
Q279: Which of the following is considered contractionary
Q281: Illustrate and explain the effects of tax
Q282: If the economy is growing beyond potential
Q283: What is the difference between fiscal policy
Q284: The federal government debt as a percentage
Q285: In the case of an upward-sloping aggregate