Multiple Choice
Figure 16-11 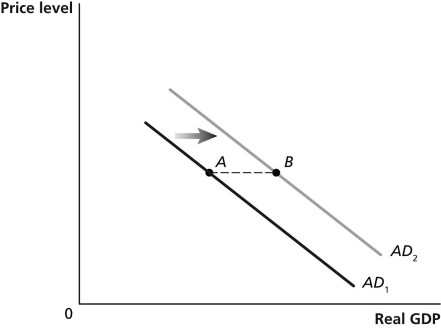
-Refer to Figure 16-11.In the graph above,the shift from AD1 to AD2 represents the total change in aggregate demand.If government purchases increased by $50 billion,then the distance from point A to point B ________ $50 billion.
A) would be equal to
B) would be greater than
C) would be less than
D) may be greater than or less than
Correct Answer:

Verified
Correct Answer:
Verified
Q74: The largest and fastest-growing category of federal
Q75: The Trump administration hopes that its program
Q76: The nation of Hyperbole is in a
Q77: Figure 16-1 <img src="https://d2lvgg3v3hfg70.cloudfront.net/TB1236/.jpg" alt="Figure 16-1
Q78: If the federal government's expenditures are less
Q80: The long-run growth rate of real GDP
Q81: Which of the following would be considered
Q82: The problem typically during a recession is
Q83: Compared to the averages for post World
Q84: Contractionary fiscal policy involves decreasing government purchases